
by Cathie Maglio
The Cruelest Month… But Fear Not
April isn’t the cruelest month in Massachusetts—it’s May. Every May, fear strikes deep into the hearts of 10th graders as the math MCAS looms on the calendar. The test measures skills in four areas: Algebra and Functions, Geometry, Number and Quantity, and Probability and Statistics. It is widely believed by students that the creators of the Massachusetts Comprehensive Assessment System chose these domains deliberately to intimidate and frustrate them.
But I propose another interpretation. I maintain that these topics were chosen because of their far-reaching applications in the real world. I substantiate my thesis by responding to the perennial protest: “When am I ever going to need that in real life?” Fear not. I will show in the following scenarios where these math standards can be encountered in the world outside the high school classroom.
Scenario 1: Geometrical Transformations
Laura and Miguel are talking about their future careers. Both love fashion and design. Laura shows Miguel a pattern she has been working on using a tessellation program she found on a design website. Miguel notices that the pattern uses transformations they learned in Geometry class. He incredulously points out that Laura is utilizing Standard G-CO.A.2 by using transformations to create congruent and noncongruent images on a plane.

As Laura and Miguel investigate further, they find other applications for this standard in architecture, landscape design, and interior design. They return immediately to their old high school to apologize to their math teacher.
Scenario 2: Binomials, Quadratics and Modeling
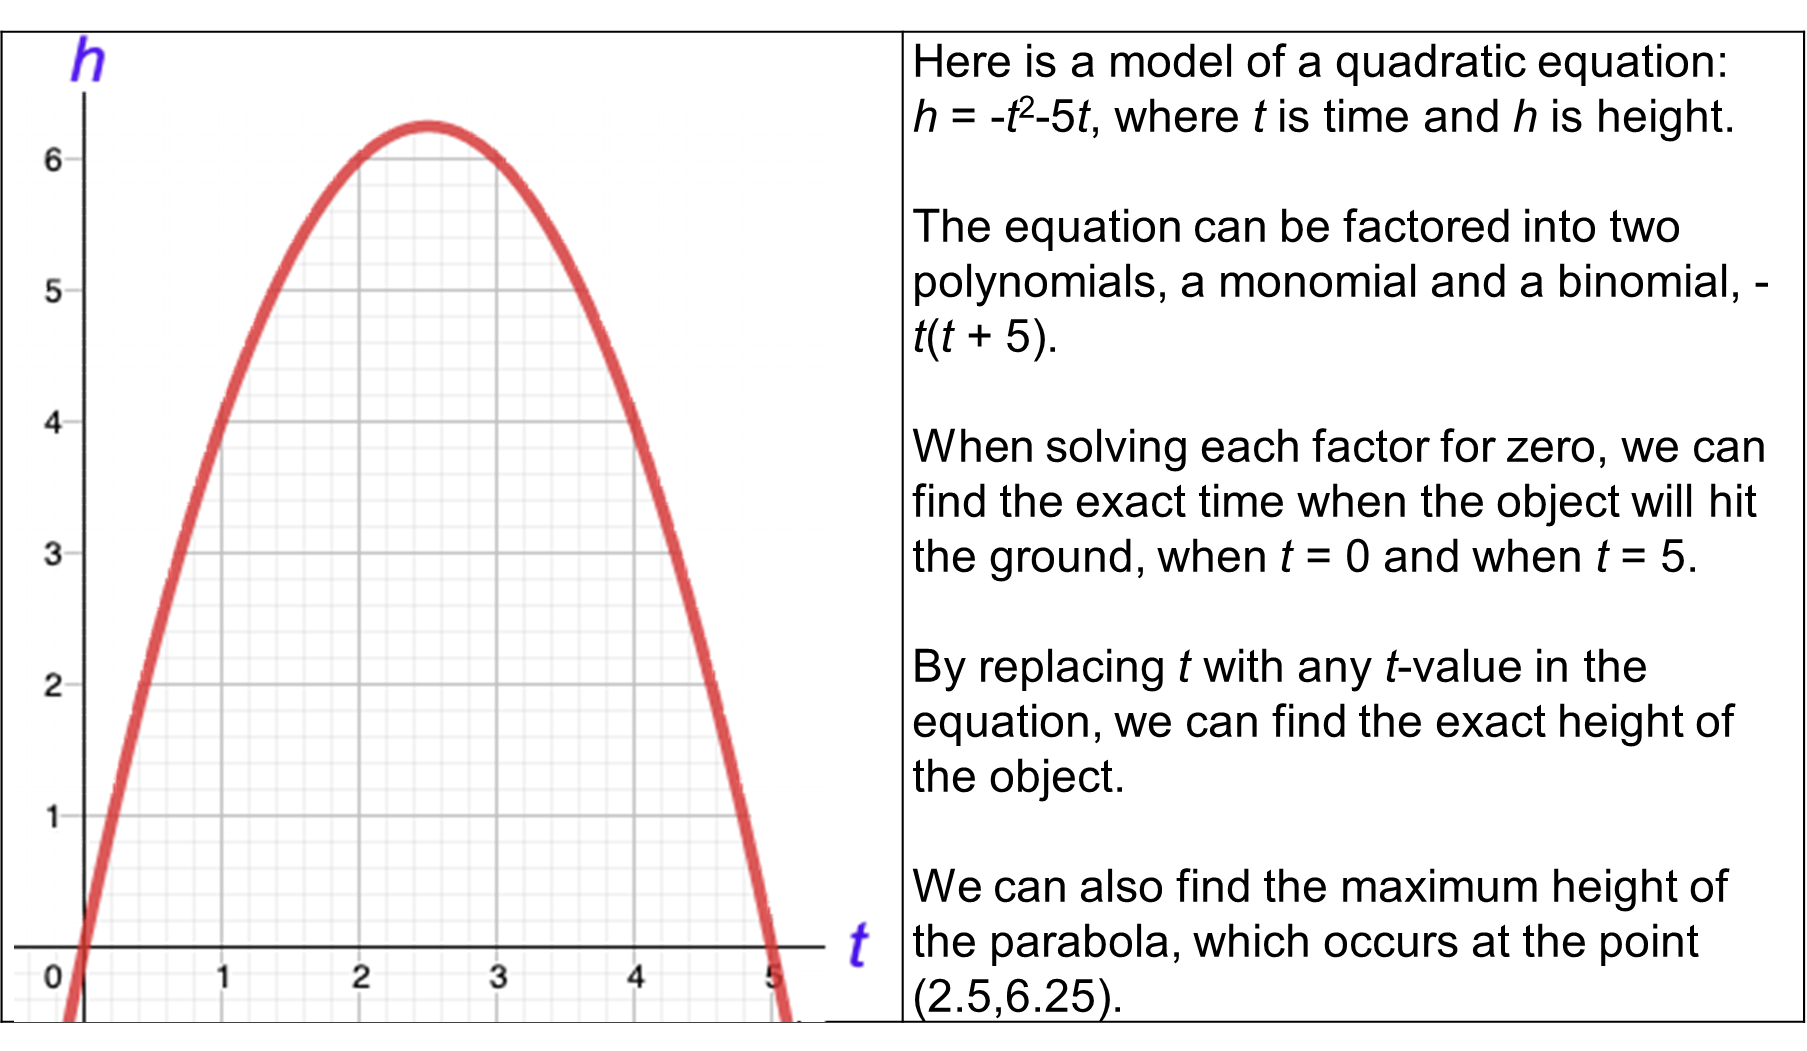
Marci is fascinated by space. She aspires to work as an aerospace engineer. She enjoys her math and science classes, especially when tracing the paths of objects dropped, tossed, or thrown into the air. These paths form a graph called a parabola, a U-shaped, symmetrical graph. These graphs enable an observer, or an engineer, to pinpoint the exact height of the object at every time interval along the curve. She can determine how high the object will go and when it will hit the ground.
The path of the object can be expressed or modeled by a quadratic equation. This equation can be broken into its binomial factors. The binomial factors impart important information, like when and how far on a grid the object will hit the ground.
This scenario includes three standards:
Standard N-Q.A.2: Modeling and estimation used to solve a real world problem.
Standard: A-APR.A.1: Multiplication of two polynomial expressions.
Standard: F-IF.A.2: Evaluation of quadratic functions for different inputs.
Other applications of these standards can be found in military operations, firefighting, sports, and physics.
Scenario 3: Lines, Scatter Plots, and Data Displays
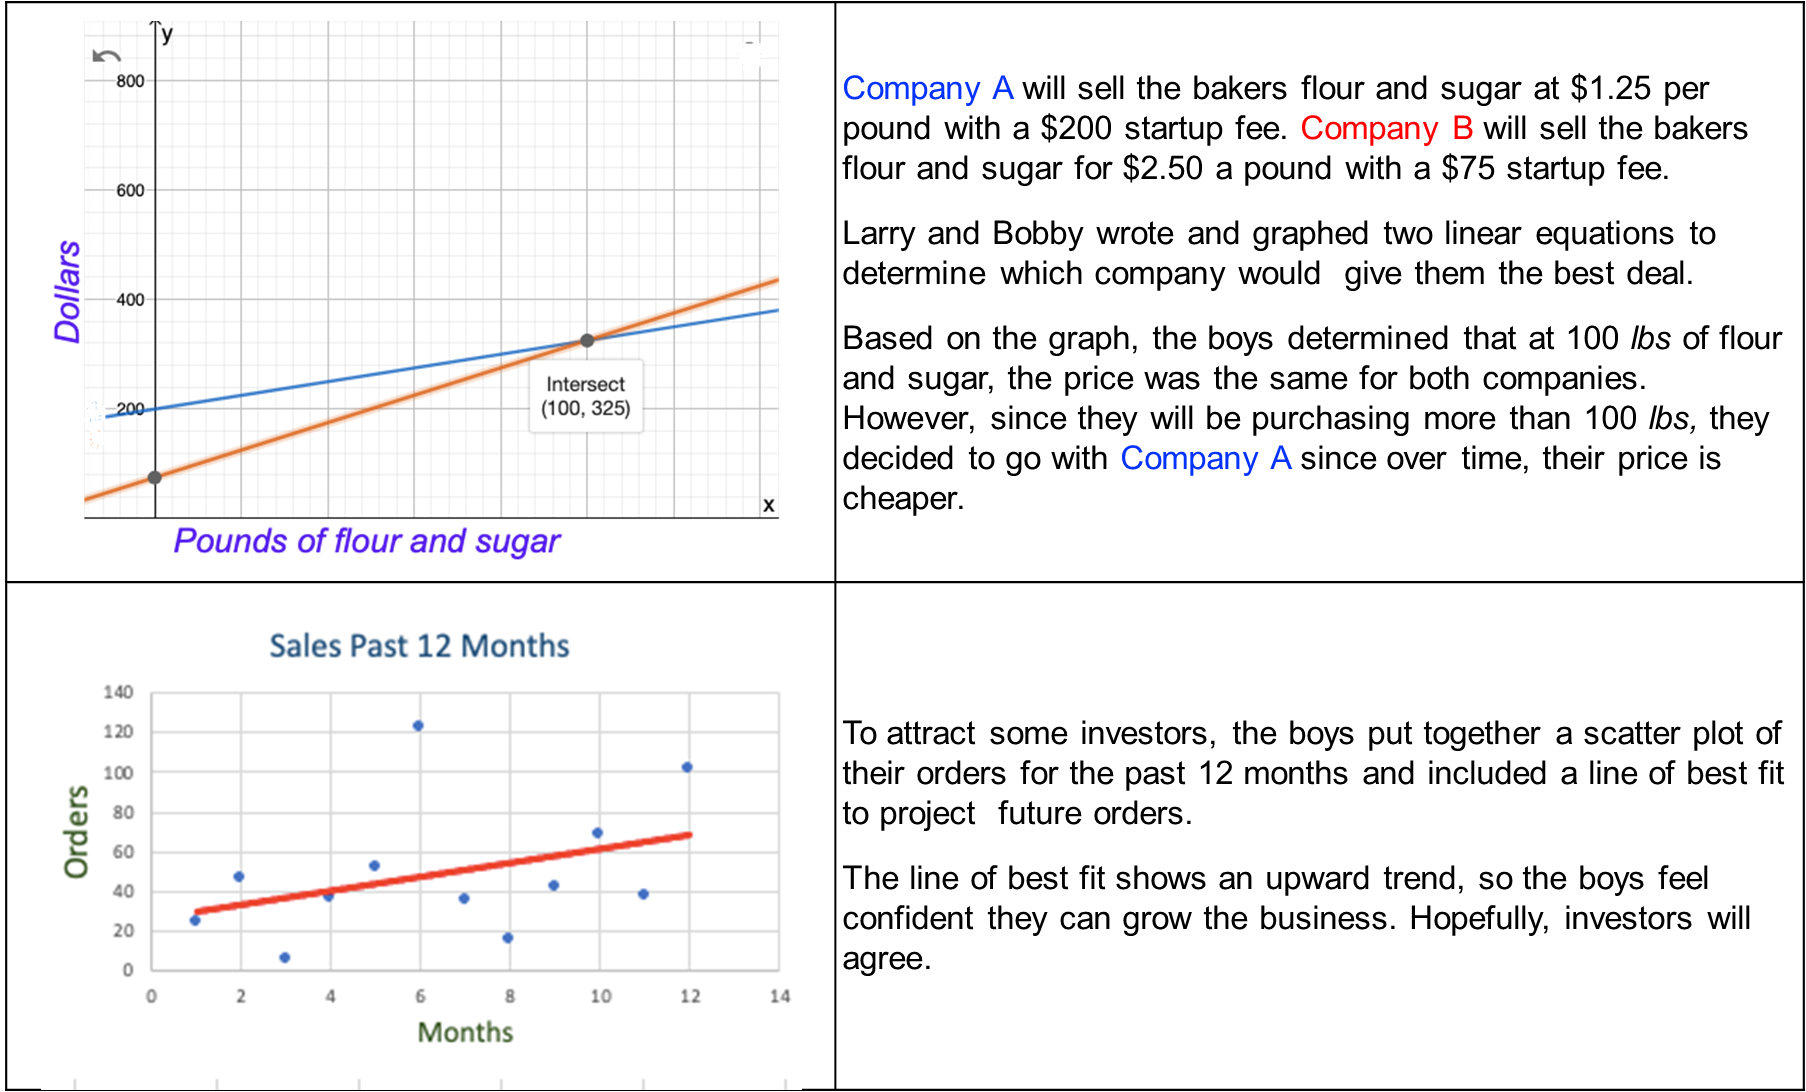
Larry and Bobby fancy themselves entrepreneurs and have turned their love of baking into a custom cookie business. To get the company off the ground, they needed to do some research on the prices of the supplies they would need to make the cookies. They created graphs comparing the prices from two different companies to determine which one offered the best deal over time. They found that a higher price in the beginning will sometimes turn out more cost-efficient over time than a lower starting price.
After the business was up and running, Larry and Bobby realized they needed more financial backing. They put together displays of sales, profits, and losses to pitch potential investors. They used scatter plots to show monthly sales and a line of best fit to predict future sales.
Standard A-CED.A.2: They determined a system of two variable equations based on a real-world situation.
Standard A-REI.C.6: They solved and graphed a system of linear equations.
Standard S-ID.B.6: They used a line of best fit for data in a scatter plot to predict a value in a real-world situation.
These standards are used in many business applications such as profit and loss statements, forecasting future earnings, and projections of business growth.
These three examples demonstrate how useful high school math can be for future careers in the “real world” outside the classroom. They suggest that all 10th graders should apologize immediately to their math teachers for doubting the relevance of their unjustly maligned subject.
Cathie Maglio is a longtime math teacher and a JFYNet Instructional Specialist.
Other posts authored by Cathie can be found here.
HOW ARE WE DOING? In our pursuit to serve up content that matters to you, we ask that you take a couple of minutes to let us know how we’re doing? Please click here to be navigated to our JFYNet Satisfaction Survey. Thank you!

